Uber & Lyft Rates & Coverage Areas – 2019 Year In Review [Infographic]
Up Hail is a search engine (launched in 2014) where users can search for ridehailing services, estimate and compare prices, and view coverage areas. Over 1 million unique search queries occurred on Up Hail in 2019 in the US. Using this data set, our data science and visualization team analyzed and discovered key insights about Uber & Lyft with regards to coverage area, pricing, services offered, average distance and duration of trips. In our infographic below, you will find some interesting stats an figures that may surprise you, as the did us.
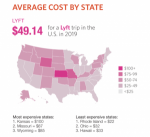
Key findings:The average Lyft ride cost $1.27 less than the cost of the average Uber ride ($49.14 vs. $50.41).The average cost of an UberX increased 15.96% from 2018 to 2019. The average cost of a Lyft (standard) increased 19.04% from 2018 to 2019.The highest average fares were in sparsely populated states like Kansas, Wyoming, and Missouri.Lyft had about 4% greater coverage in the US than Uber, in terms of number of cities with the service.Lyft had 3,128 cities in the US with a shared carpool option, and Uber had less at 2,453.Less than 300 cities out of 39,395 in the US do not have coverage by either provider.
We created this infographic to help you visualize the key differences between the providers, and encourage you to share it. Download a PDF.
![Uber & Lyft Rates & Coverage Areas – 2019 Year In Review [Infographic]](http://3.80.106.79/wp-content/uploads/2020/02/2019-year-in-review-uber-lyft-785x2048-1.png)